- Éducation
- First Steps
- Trends
Trends
Understanding trends is one of the basics of reading a trading chart. Discover how simple it is to follow market trends. This quick read is your key to unlocking trading success.
- Trends: Follow the market direction
- Trend types: Upward (Bullish), Downward (Bearish), Sideways (Flat)
- How to identify a trend
- Using tools to confirm a trend
- Trading strategies for different trends
Trends
Market trends represent the direction of price movement in a chart, providing a clear picture of the market's behavior. Recognizing these trends is crucial for making informed trading decisions.
Trend types
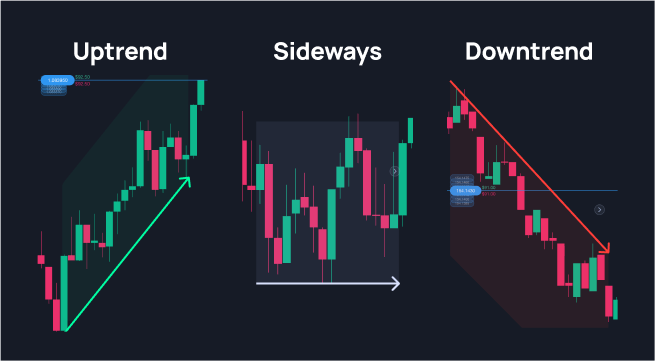
- Upward (Bullish): When prices are on the rise and the chart shows an upward trajectory, it signifies a bullish market. This is often seen as an opportunity to engage in "up" trades.
- Downward (Bearish): Conversely, a falling price and a downward-moving chart indicate a bearish trend. In such scenarios, traders are advised to be cautious with "up" trades.
- Sideways (Flat): Sometimes, prices neither rise significantly nor fall but move within a narrow range. This flat trend suggests a period of indecision in the market, allowing for short-term trades based on minor price fluctuations.
How to identify a trend
Start by looking at the chart over a wider timeframe rather than focusing on the latest candle or price movement. Ask yourself whether the overall price is moving up, moving down, or staying within the same range.
Then look at the highs and lows. Higher highs and higher lows point to an upward trend, while lower highs and lower lows suggest a downward trend. If the highs and lows remain around similar levels, the market may be moving sideways.
You can also change the chart type to make the trend easier to see. An Area chart provides a simple overview of the overall direction, while Candlestick charts give you more detail about individual price movements. If you’re learning trend analysis, Candlesticks can be particularly useful because they show the open, close, high, and low for each period.
Using tools to confirm a trend
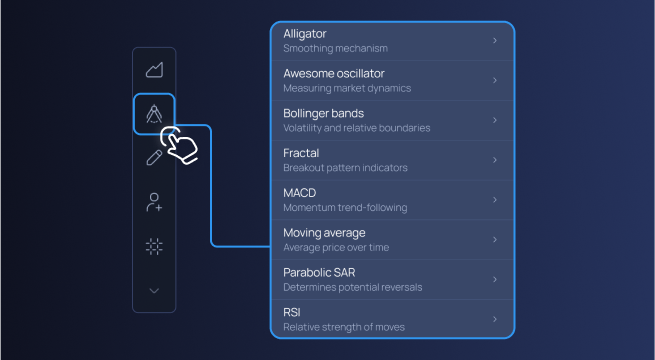
Once you have a possible trend in mind, use the platform’s analysis tools to check whether the price movement supports what you’re seeing. For example, you can add technical indicators to the chart and compare their signals with the overall price direction.
It’s also useful to check more than one timeframe. A short-term chart might show a temporary move in the opposite direction of the broader trend. Looking at a longer timeframe first can help put these smaller movements into context.
Trading strategies for different trends
After identifying the trend, look for setups that match the market direction.
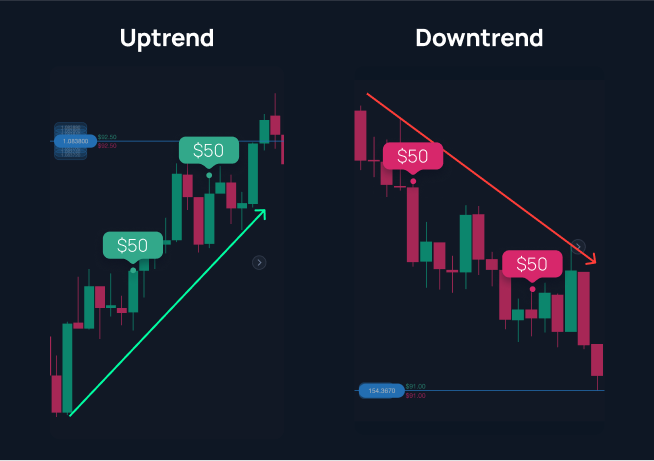
- In a bullish market, look for opportunities to call or go long, capitalizing on the upward momentum.
- In a bearish market, it might be wise to put or go short, anticipating further declines.
- During flat trends, consider short-term trades that leverage small price movements, but always be mindful of the risks involved.
Tip: check the overall direction, identify the highs and lows, confirm the trend with your chart and analysis tools, then look for a setup that matches it. This approach can help you avoid making decisions based only on the latest price movement.
No trend lasts forever, so treat trend identification as a way to understand current market conditions rather than a guarantee of what happens next. Practise spotting bullish, bearish, and sideways markets on the demo account before applying your analysis to real-money trades.